Matplotlib
Vous trouverez un très bon tutoriel pour un premier contact avec matplotlib ici : http://www.loria.fr/~rougier/teaching/matplotlib/
[1]:
import numpy as np  # numpy pour créer et manipuler des données
import matplotlib.pyplot as plt  # la formule magique
[2]:
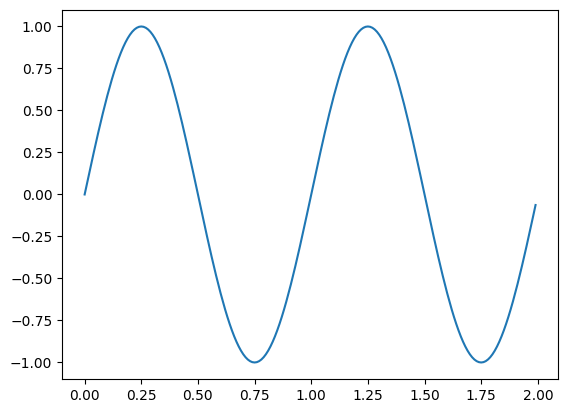
# on se fabrique quelques données
t = np.arange(0.0, 2.0, 0.01)
s = np.sin(2 * np.pi * t)
[3]:
# on trace une courbe sommaire

plt.plot(t, s)

plt.show()  # cette ligne provoque l'affichage de la courbe
[4]:
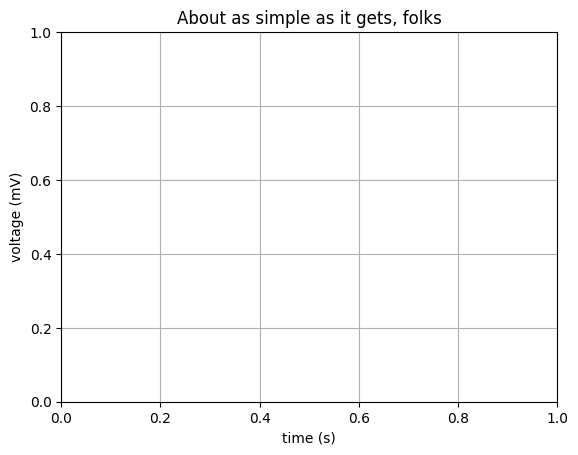
# on peut évidemment décorer un peu tout ça
plt.xlabel('time (s)')
plt.ylabel('voltage (mV)')
plt.title('About as simple as it gets, folks')
plt.grid(True)

plt.show()
[5]:
# enregistrement
plt.savefig("test.png")
<Figure size 640x480 with 0 Axes>
Pour aller plus loin : http://www.loria.fr/~rougier/teaching/matplotlib/
Pour trouver l’inspiration : http://matplotlib.org/gallery.html